ProSync™ Production
Track Performance. Identify Issues. Drive Improvement.
Overall Sync Status
88%
SAME as last week
Time to Services
5 days
Worse than last week
System Health Score
B+
SAME as last week
Daily Utilization
8.2 hrs
Worse than last week
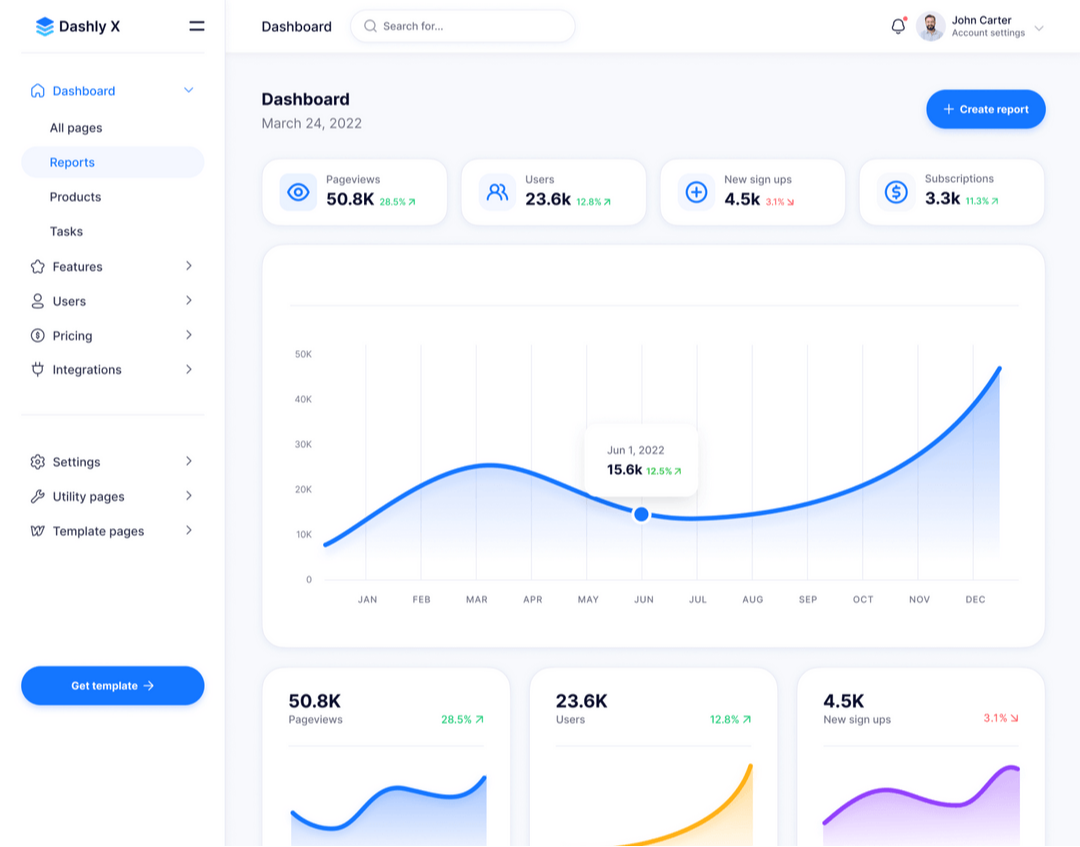
Turn Data into action with ProSync™ Reports
ProSync™ Reports give you a complete picture of your simulation environment in one place. From system synchronization to engineering utilization, every report is built to support smarter decisions, faster actions, and greater simulator ROI. Whether standard or customized, your reports help turn data into action.
The dashboard summarizes critical insights across seven key areas:
- KPI Cards provide real-time metrics for health, sync status, service timing, and daily usage.
- System Panels break down the condition of your Production, Offline, and Simulator systems.
- Utilization Charts show who’s using the simulator and how.
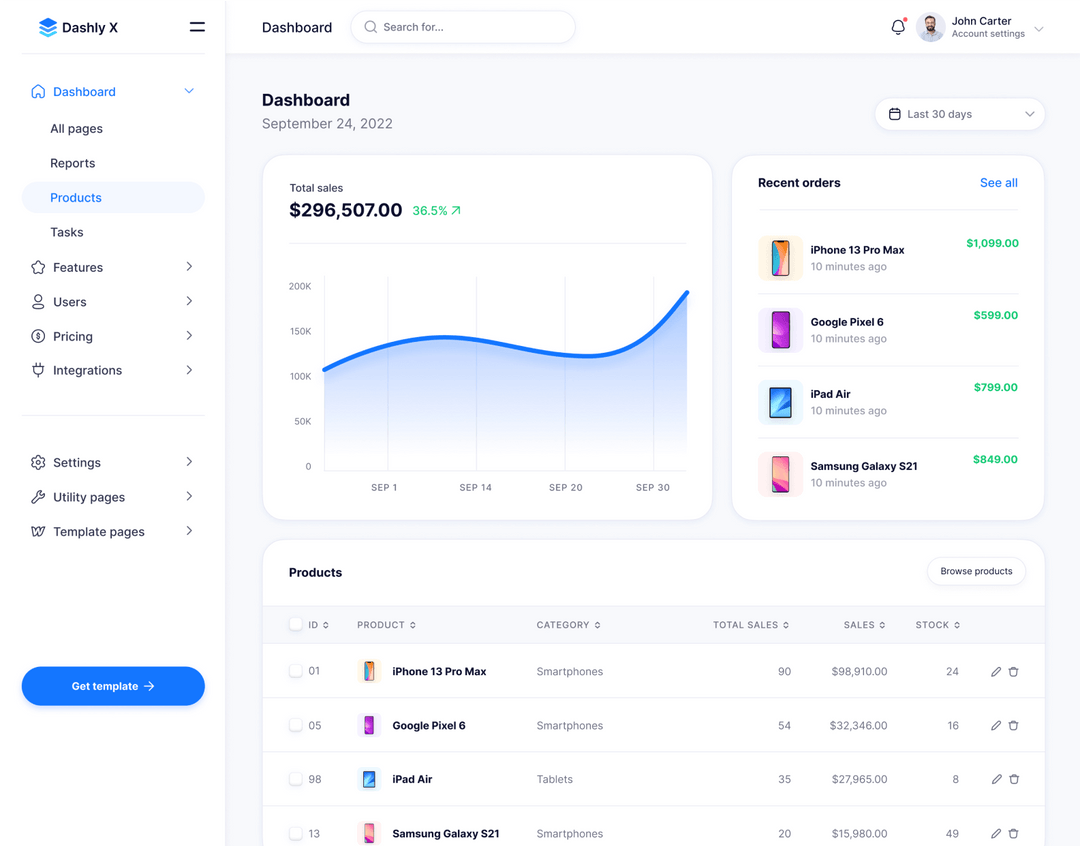
- Service Activity tracks completed work and upcoming needs.
- Activity Logs capture recent changes with detailed context.
- To-Do Lists guide proactive maintenance.
- Export Tools simplify reporting and sharing across teams.
Everything you need to manage, maintain, and maximize your simulator delivered in one unified view.
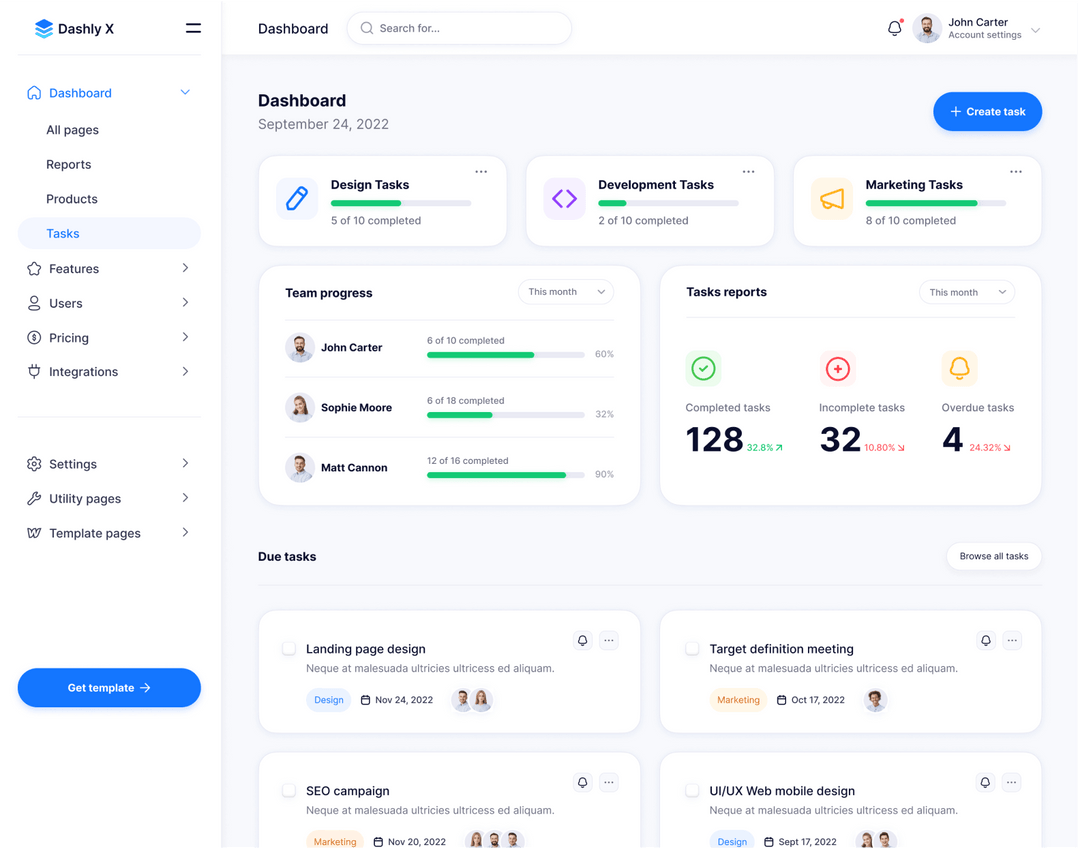
Overall System Utilization
Services Summary
Mimic Standard Model Aspen Model IO Model DeltaV Simulate Training Scenarios Maintenance
